Traffic Safety Rights
Early Estimate of Motor Vehicle Traffic Fatalities in 2023
Summary
A statistical projection of traffic fatalities for 2023 shows an estimated 40,990 people died in motor vehicle traffic crashes, a decrease of about 3.6 percent as compared to 42,514 fatalities reported to have occurred in 2022, as shown in Table 1. The fourth quarter of 2023 represents the seventh consecutive quarterly decline in fatalities beginning with the second quarter of 2022. Preliminary data reported by the Federal Highway Administration (FHWA) show that vehicle miles traveled (VMT) in 2023 increased by about 67.5 billion miles, or about a 2.1-percent increase. Also shown in Table 1 are the fatality rates per 100 million VMT, by quarter. The fatality rate for 2023 decreased to 1.26 fatalities per 100 million VMT, down from the reported rate of 1.33 fatalities per 100 million VMT in 2022. For the NHTSA Regional differences, 8 of 10 Regions are estimated to have decreases in fatalities, and 9 of 10 Regions are estimated to have decreases in fatality rate per 100 million VMT in 2023 as compared to 2022. Also, 35 States are projected to have experienced decreases in fatalities. The fatality counts for 2022 and 2023 and the ensuing percentage change from 2022 to 2023 will be further revised as the FARS final file for 2022 and the annual report file for 2023 are available next year.
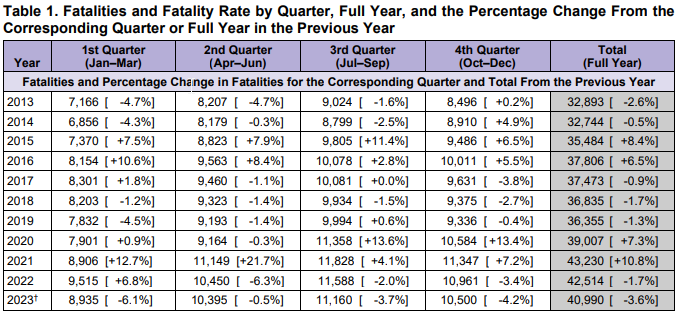
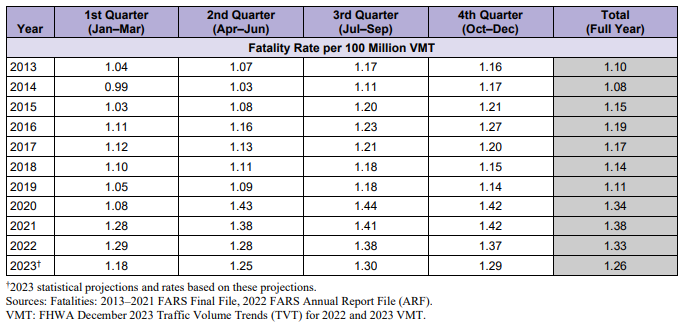
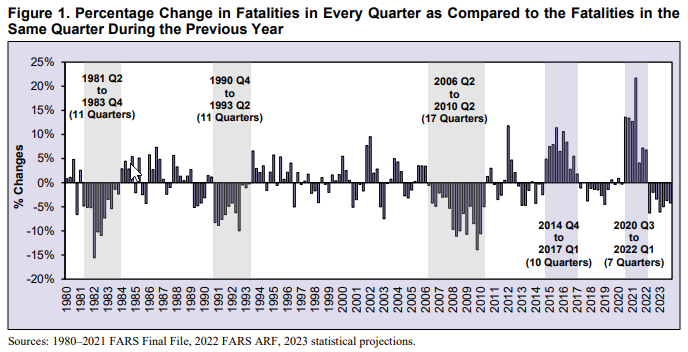
Figure 1 shows the historical trend of the percentage change every quarter from the same quarter in the previous year, going back to 1980 (NHTSA has fatality data since 1975). The shading in the chart shows the years when there were significant numbers of consecutive quarters with increases/declines as compared to the corresponding quarters of the previous years. The declines during the early 1980s and 1990s lasted 11 consecutive quarters, while the most recent decline occurred over 17 consecutive quarters ending in the second quarter of 2010. More recently, the significant increases in fatalities occurred over 10 consecutive quarters ending after the first quarter of 2017. In addition, fatalities increased 7 consecutive quarters beginning with the third quarter of 2020, until the 6.3-percent decline seen in the second quarter of 2022. The third and fourth quarter of 2020 and the first and especially the second quarter of 2021 showed significant increases in fatalities as compared to the corresponding quarters of 2019 and 2020. The percentage increase in the second quarter of 2021 is actually the highest quarterly percentage increase in FARS data recorded history. The fourth quarter of 2023 represents the seventh quarterly decline in fatalities beginning with the second quarter of 2022.
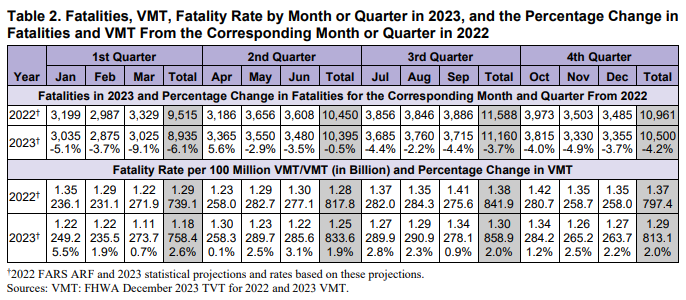
The quarterly projections of fatalities, fatality rates, and VMT are further split into monthly estimates for 2022 and 2023, as shown in Table 2. In 2023 both fatalities and the fatality rate per 100 million VMT show decreases in all months except for April, which showed an increase, as compared to the corresponding month in 2022.
Regional Differences
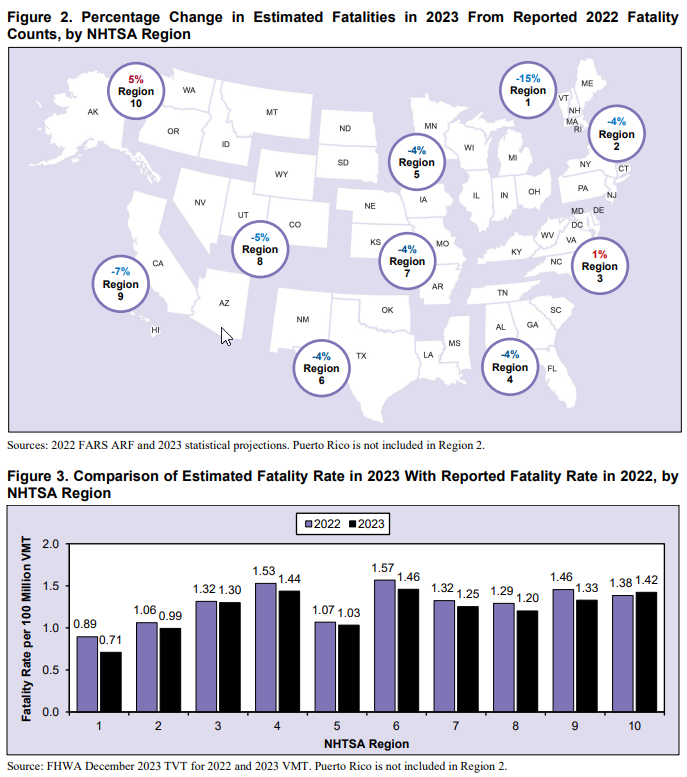
The statistical procedures used in these projections were generated for each NHTSA administrative Region and were collated to create the national estimate. This allows for the comparison of Regional estimates in 2023 with the reported 2022 counts. Figure 2 shows the percentage change in estimated fatalities in 2023 from the reported fatalities in 2022 by NHTSA Region; 8 of the 10 Regions experienced decreases. Figure 3 shows the comparison of the estimated fatality rate per 100 million VMT in 2023 with the reported fatality rate per 100 million VMT in 2022, by NHTSA Region; 9 of 10 Regions presented decreases. These estimates by NHTSA Region shown in Figures 2 and 3 are subject to change as the FARS final file for 2022 and the annual report file for 2023 are available next year.
State Differences
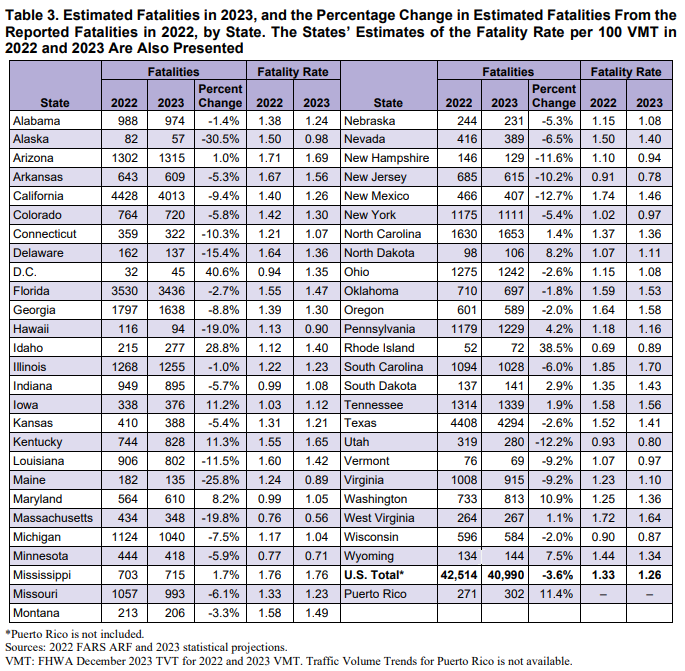
Given the significant interest in the traffic safety community in estimated changes at the State level to assess emerging trends, NHTSA has developed a methodology in the third quarter of 2022 to generate such State-level estimates based on the most recent distribution of the fatalities by State in a NHTSA Region and the month (see Data and Methodology section for more details). Table 3 shows the comparison of each State’s estimate in 2023 with the reported fatality counts in 2022 and the percentage change in 2023 from 2022; 35 States are projected to have experienced decreases in fatalities in 2023 as compared to 2022, while 15 States, the District of Columbia, and Puerto Rico are projected to have had increases in fatalities. Also, the estimates of the fatality rate per 100 million VMT by State in 2022 and 2023 are presented in Table 3 of this report. These estimates by State shown in Table 3 are subject to change as the FARS final file for 2022 and the annual report file for 2023 are reported, and as FHWA finalizes the State VMT estimates for 2022 and 2023.
Discussion
During the COVID-19 pandemic there were marked increases in fatalities and the fatality rate per 100 million VMT in 2020. The increased trend of fatalities in 2020 have continued into 2021 and the first quarter of 2022. The second, third, and fourth quarters of 2022, and all 4 quarters of 2023 have experienced a decline in fatalities after 7 consecutive quarters of year-to-year increases in fatalities, since the third quarter of 2020. The increased trend of the fatality rate per 100 million VMT in 2020 has continued into the first quarter of 2021, decreased in the second and the third quarters of 2021, and increased again in the first quarter of 2022. There was a decrease in the second, third, and fourth quarters of 2022, and in all 4 quarters of 2023. NHTSA is continuing to gather and finalize data on crash fatalities for 2022 and 2023 using information from police crash reports and other sources. The Final File for 2022 as well as the Annual Report File for 2023 will be available in in the early part of 2025 that usually results in the revision of fatality totals and the ensuing fatality rates and percentage changes.
Data and Methodology
The data used in this analysis come from several sources: NHTSA’s FARS, Early Notification (EN) data, and Monthly Fatality Counts (MFC) (the EN and MFC data are not available to the public); and from FHWA’s VMT estimates. FARS is a census of fatal traffic crashes in the 50 States, the District of Columbia, and Puerto Rico. To be included in FARS, a crash must involve a motor vehicle traveling on a trafficway and must result in the death of at least one person (occupant of a vehicle or a nonoccupant) within 30 days of the crash. FARS final files from 2003 to 2021 and the FARS annual report file in 2022 are used to obtain the monthly fatality counts. The EN program is designed as an Early Fatality Notification System to capture fatality counts from States more rapidly and provide near-real-time notification of fatality counts from all jurisdictions reporting to FARS. The MFC data provide monthly fatality counts by State through sources that are independent from the EN or FARS systems. MFCs from January 2003 up to December 2023 are used. MFCs are reported midmonth for all prior months of the year. To estimate the traffic fatality counts for 2023, the time series cross-section regression procedure was applied to analyze the data with both cross-sectional values (by NHTSA Region) and time series (by month), to model the relationship among FARS, MFC, and EN, the details of which are available in a Research Note (Statistical Methodology to Make Early Estimates of Motor Vehicle Traffic Fatalities, Report No. DOT HS 811 123). Furthermore, after the projected fatality counts for NHTSA Region r and the month m (F_Estmr) are obtained, the estimated fatality counts for a State st in Region r and the month m (F_Estst|mr) are calculated. Each State receives a proportion of the projected fatality counts for the Region using the most recent relative proportion of fatalities in each State st for Region r and month m found in the Early Notification data. This can be expressed as F_Estst|mr = (Fst|mr /∑all States in r Fst|mr) × F_Estmr , where Fst|mr is the latest fatal count in the Early Notification data for State st in Region r and month m. That is, the inflation rate for all States within a region is assumed to be the same as the inflation rate of that region. For example, the estimated motor vehicle traffic fatalities for Arizona in Region 9 (Arizona, California, Hawaii) and the month m is: F_EstAZ|m9 = (FAZ|m9 /(FAZ|m9 + FCA|m9 + FHI|m9)) × F_Estm9. The methodology used to generate the national, regional, and State-level estimates for 2023 is the same as the one used by NHTSA to project the motor vehicle traffic fatalities for the first nine months of 2023 (Early Estimates of Motor Vehicle Traffic Fatalities for the First Nine Months [January–September] of 2023, Report No. DOT HS 813 530).
The suggested APA format citation for this document is: National Center for Statistics and Analysis. (2024, April). Early estimate of motor vehicle traffic fatalities in 2023 (Crash•Stats Brief Statistical Summary. Report No. DOT HS 813 561). National Highway Traffic Safety Administration.
Copyright © – https://crashstats.nhtsa.dot.gov/Api/Public/ViewPublication/813561